Neo4J Graph Database Anti-Fraud Analysis in Practice (IV) - Risk Scoring

1 Preface
In the Neo4J graph database anti-fraud series, we have identified risky users. This article will explain how to score the risk of each customer. If you need to review the previous articles, you can directly jump to the links:
- Introduction to Graph Database
- Neo4j Graph Database Anti-Fraud Analysis In Practice (I) - Build Analysis Environment
- Neo4j Graph Database Anti-Fraud Analysis In Practice (II) - Data Preparation
- Neo4j Graph Database Anti-Fraud Analysis In Practice (III) - Identify Criminal Organizations
2 Finding Similar Nodes
Last time, we used the Weakly Connected Components algorithm to cluster the data. Next, we can look for similar customers in each cluster.
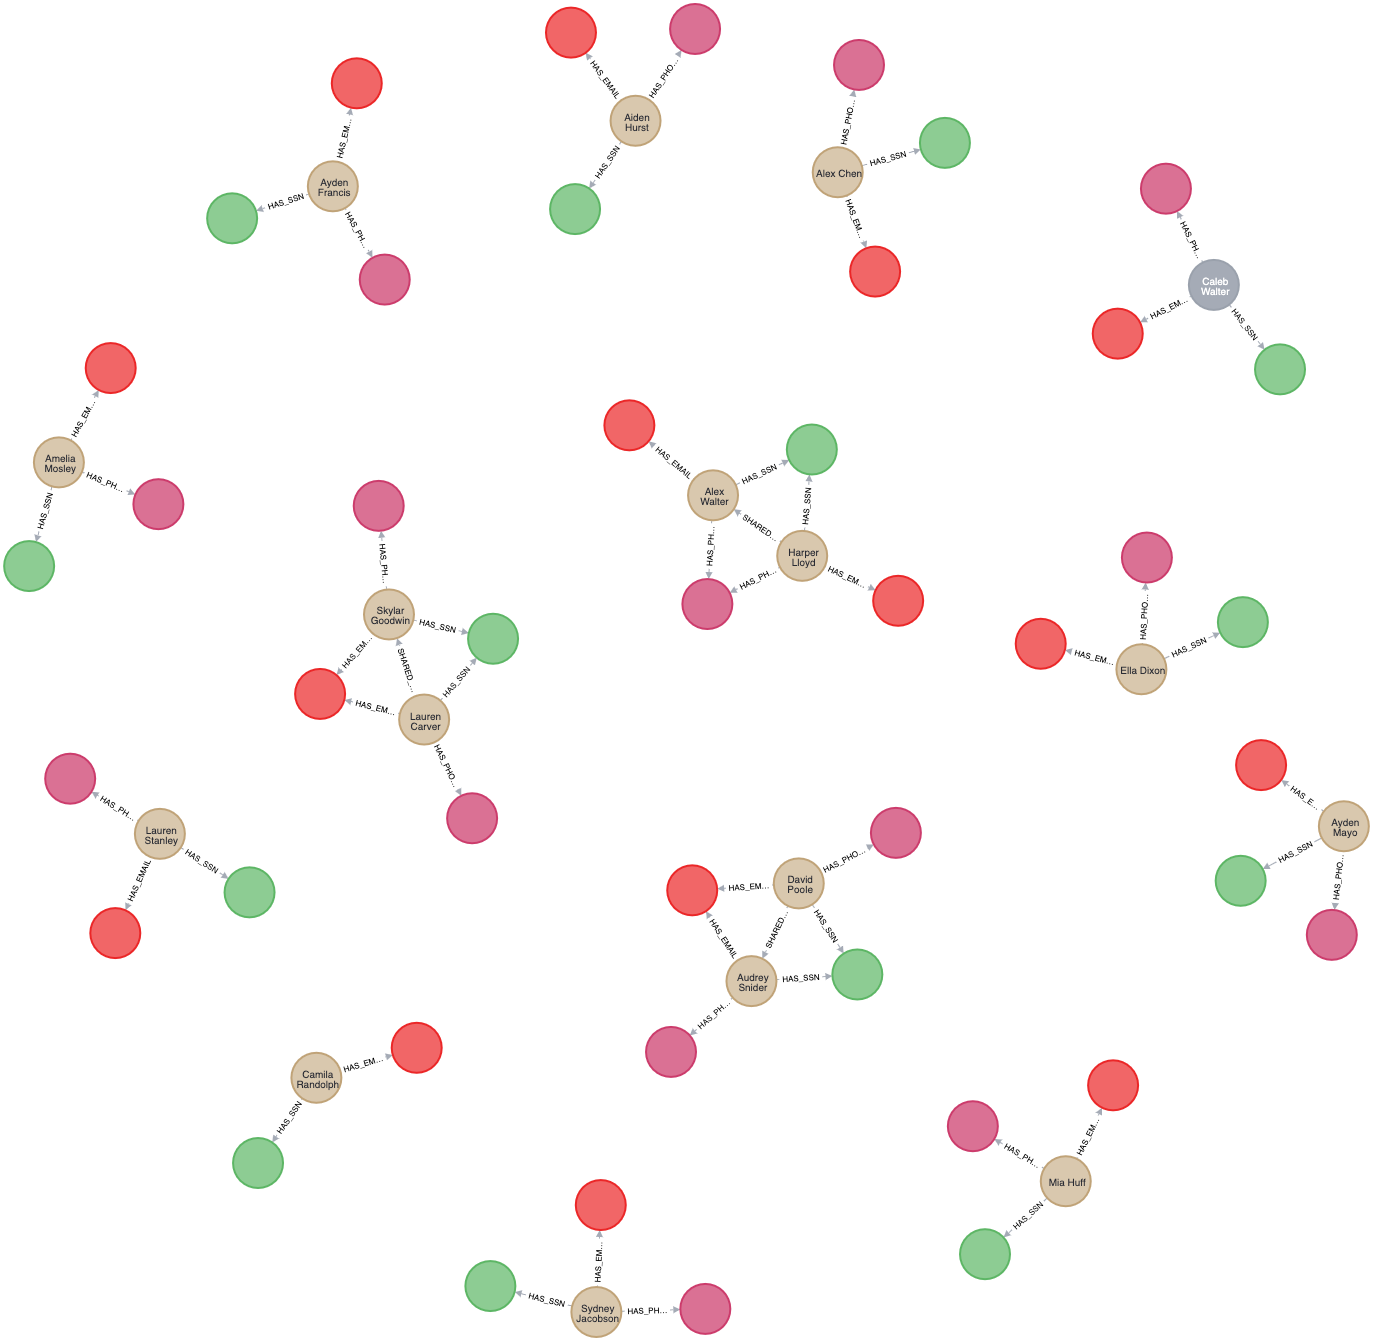
This step uses node similarity (Jaccard coefficient) to judge. The node similarity algorithm requires two types of nodes in the graph structure, so we create the Similarity graph, which contains two types of nodes: Client and Entity information nodes, and their corresponding relationships.
CALL gds.graph.project.cypher('Similarity',
'MATCH(c:Client)
    WHERE exists(c.firstPartyFraudGroup)
    RETURN id(c) AS id,labels(c) AS labels
UNION
MATCH(n)
    WHERE n:Email OR n:Phone OR n:SSN
    RETURN id(n) AS id,labels(n) AS labels',
'MATCH(c:Client)
-[:HAS_EMAIL|:HAS_PHONE|:HAS_SSN]->(ids)
WHERE exists(c.firstPartyFraudGroup)
RETURN id(c) AS source,id(ids) AS target')
YIELD graphName,nodeCount,relationshipCount;
After creating the graph, we can run the node similarity algorithm (note: the algorithm supports weighting, see the documentation for details):
CALL gds.nodeSimilarity.stream('Similarity',{topK:15})
YIELD node1,node2,similarity
RETURN gds.util.asNode(node1).id AS client1,
    gds.util.asNode(node2).id AS client2,similarity
ORDER BY similarity;
Use the Mutate mode to write the results to the graph in memory, creating a new relationship SIMILAR_TO. At this point, the similarity between the pairs of similar nodes can be measured using the jaccardScore:
CALL gds.nodeSimilarity.mutate('Similarity',{topK:15,
  mutateProperty:'jaccardScore', mutateRelationshipType:'SIMILAR_TO'});

-- Write the results from the in-memory graph to the database
CALL gds.graph.writeRelationship('Similarity','SIMILAR_TO','jaccardScore');
3 Creating Risk Scores
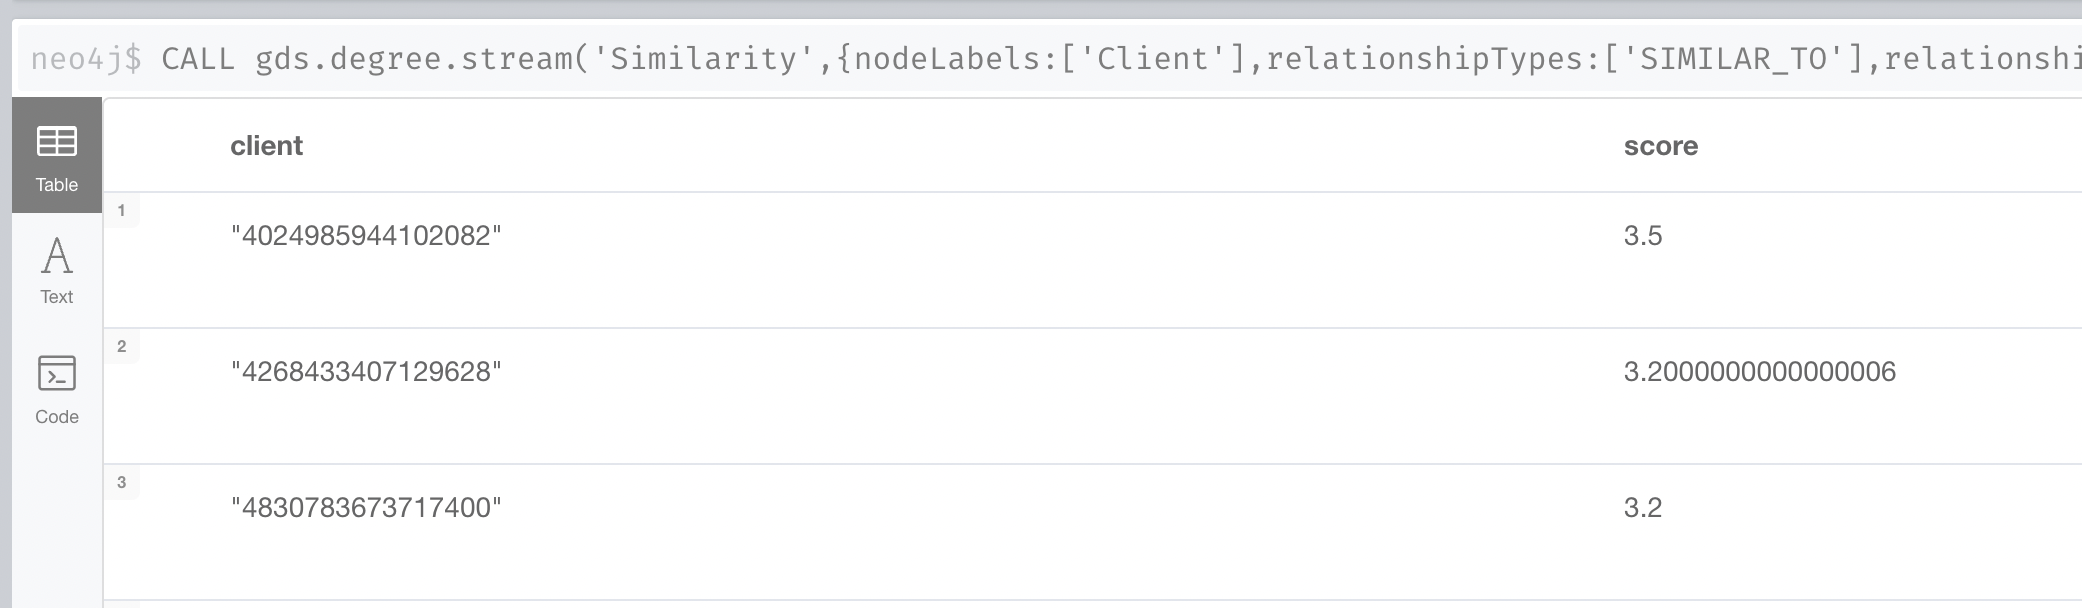
Next, we use the Node Centrality algorithm combined with the similarity indicator generated above to generate a firstPartyFraudScore. The higher the firstPartyFraudScore, the more similar the entity information of the client with many customers in a cluster, indicating that it is more dangerous.
CALL gds.degree.write('Similarity',{nodeLabels:['Client'],
    relationshipTypes:['SIMILAR_TO'],
    relationshipWeightProperty:'jaccardScore',
    writeProperty:'firstPartyFraudScore'});
Finally, we select the 80th percentile as the threshold to mark dangerous clients. In actual applications, you can also use firstPartyFraudScore as a separate feature and integrate it into an anti-fraud strategy or model.
MATCH(c:Client)
WHERE exists(c.firstPartyFraudScore)
WITH percentileCont(c.firstPartyFraudScore, 0.8)
    AS firstPartyFraudThreshold
MATCH(c:Client)
WHERE c.firstPartyFraudScore>firstPartyFraudThreshold
SET c:FirstPartyFraudster;
4 Summary
The Neo4J Graph Database Anti-Fraud Analysis Practical Series has come to an end. Through this series of articles, we have learned and consolidated the following knowledge points:
- Basics of graph structure
- Neo4J graph database query language Cypher common commands
- Common algorithms in anti-fraud applications