Introduction to Google Analytics
1. Introduction
Many products and strategic decisions on the internet today are driven by data. For example, at BulletTech, when operating WeChat official accounts, we monitor important indicators such as traffic sources, replication, and follow-up after reading through backend data for each article. This data can help us analyze reader preferences, traffic channels, and make flexible adjustments to article themes and promotional strategies. For platforms that already have a good data analysis infrastructure, ready-made solutions can save decision makers a lot of time. But if you have built a product from scratch, how do you construct the infrastructure and strategy for data analysis? This article will take BulletTech's blog as an example to introduce how to use Google Analytics (Google Analytics) to analyze website performance.
2. The Role of Google Analytics
Google Analytics is a free tool released by Google for website and mobile app analysis. After Google Analytics is configured on a website, it can capture user behavior data on the website to help optimize it. Google Analytics plays an important role in the following areas of analysis:
- Marketing: Google Analytics can clearly show the behavior and conversion rates of users from each channel on the website, helping to optimize inferior channels.
- Search Engine Optimization (SEO): Google Analytics has multiple dimensions for traffic acquisition, allowing you to see which content helps get more clicks.
- Site content: Information such as which pages users stay on longest, which pages are viewed the most, which pages have the highest conversion rates, site performance, etc. can be seen in Google Analytics and are key information for optimizing content.
3. Tips for Using Google Analytics
Firstly, you need to configure Google Analytics for your website. Google provides a detailed tutorial, so it will not be repeated here. With a few simple steps, you can deploy a tracking ID or tracking code on your website and Google Analytics can help collect data. This data is a precious resource for analysis and decision making in the future.
Google Analytics provides many dimensions of data for users to build their own analysis reports. The Google Analytics sidebar is classified by data type:
- Home: Important indicators preset by Google.
- Custom: User-defined reports.
- Real-time: Real-time data on the site.
- Audience: User profile data.
- Acquisition: Traffic profile data.
- Behavior: User behavior data on the site.
- Conversion: Conversion data for goals and e-commerce.
Basically, in each type, there is an overview and a detailed presentation of specific data details in subcategories.
3.1 Home
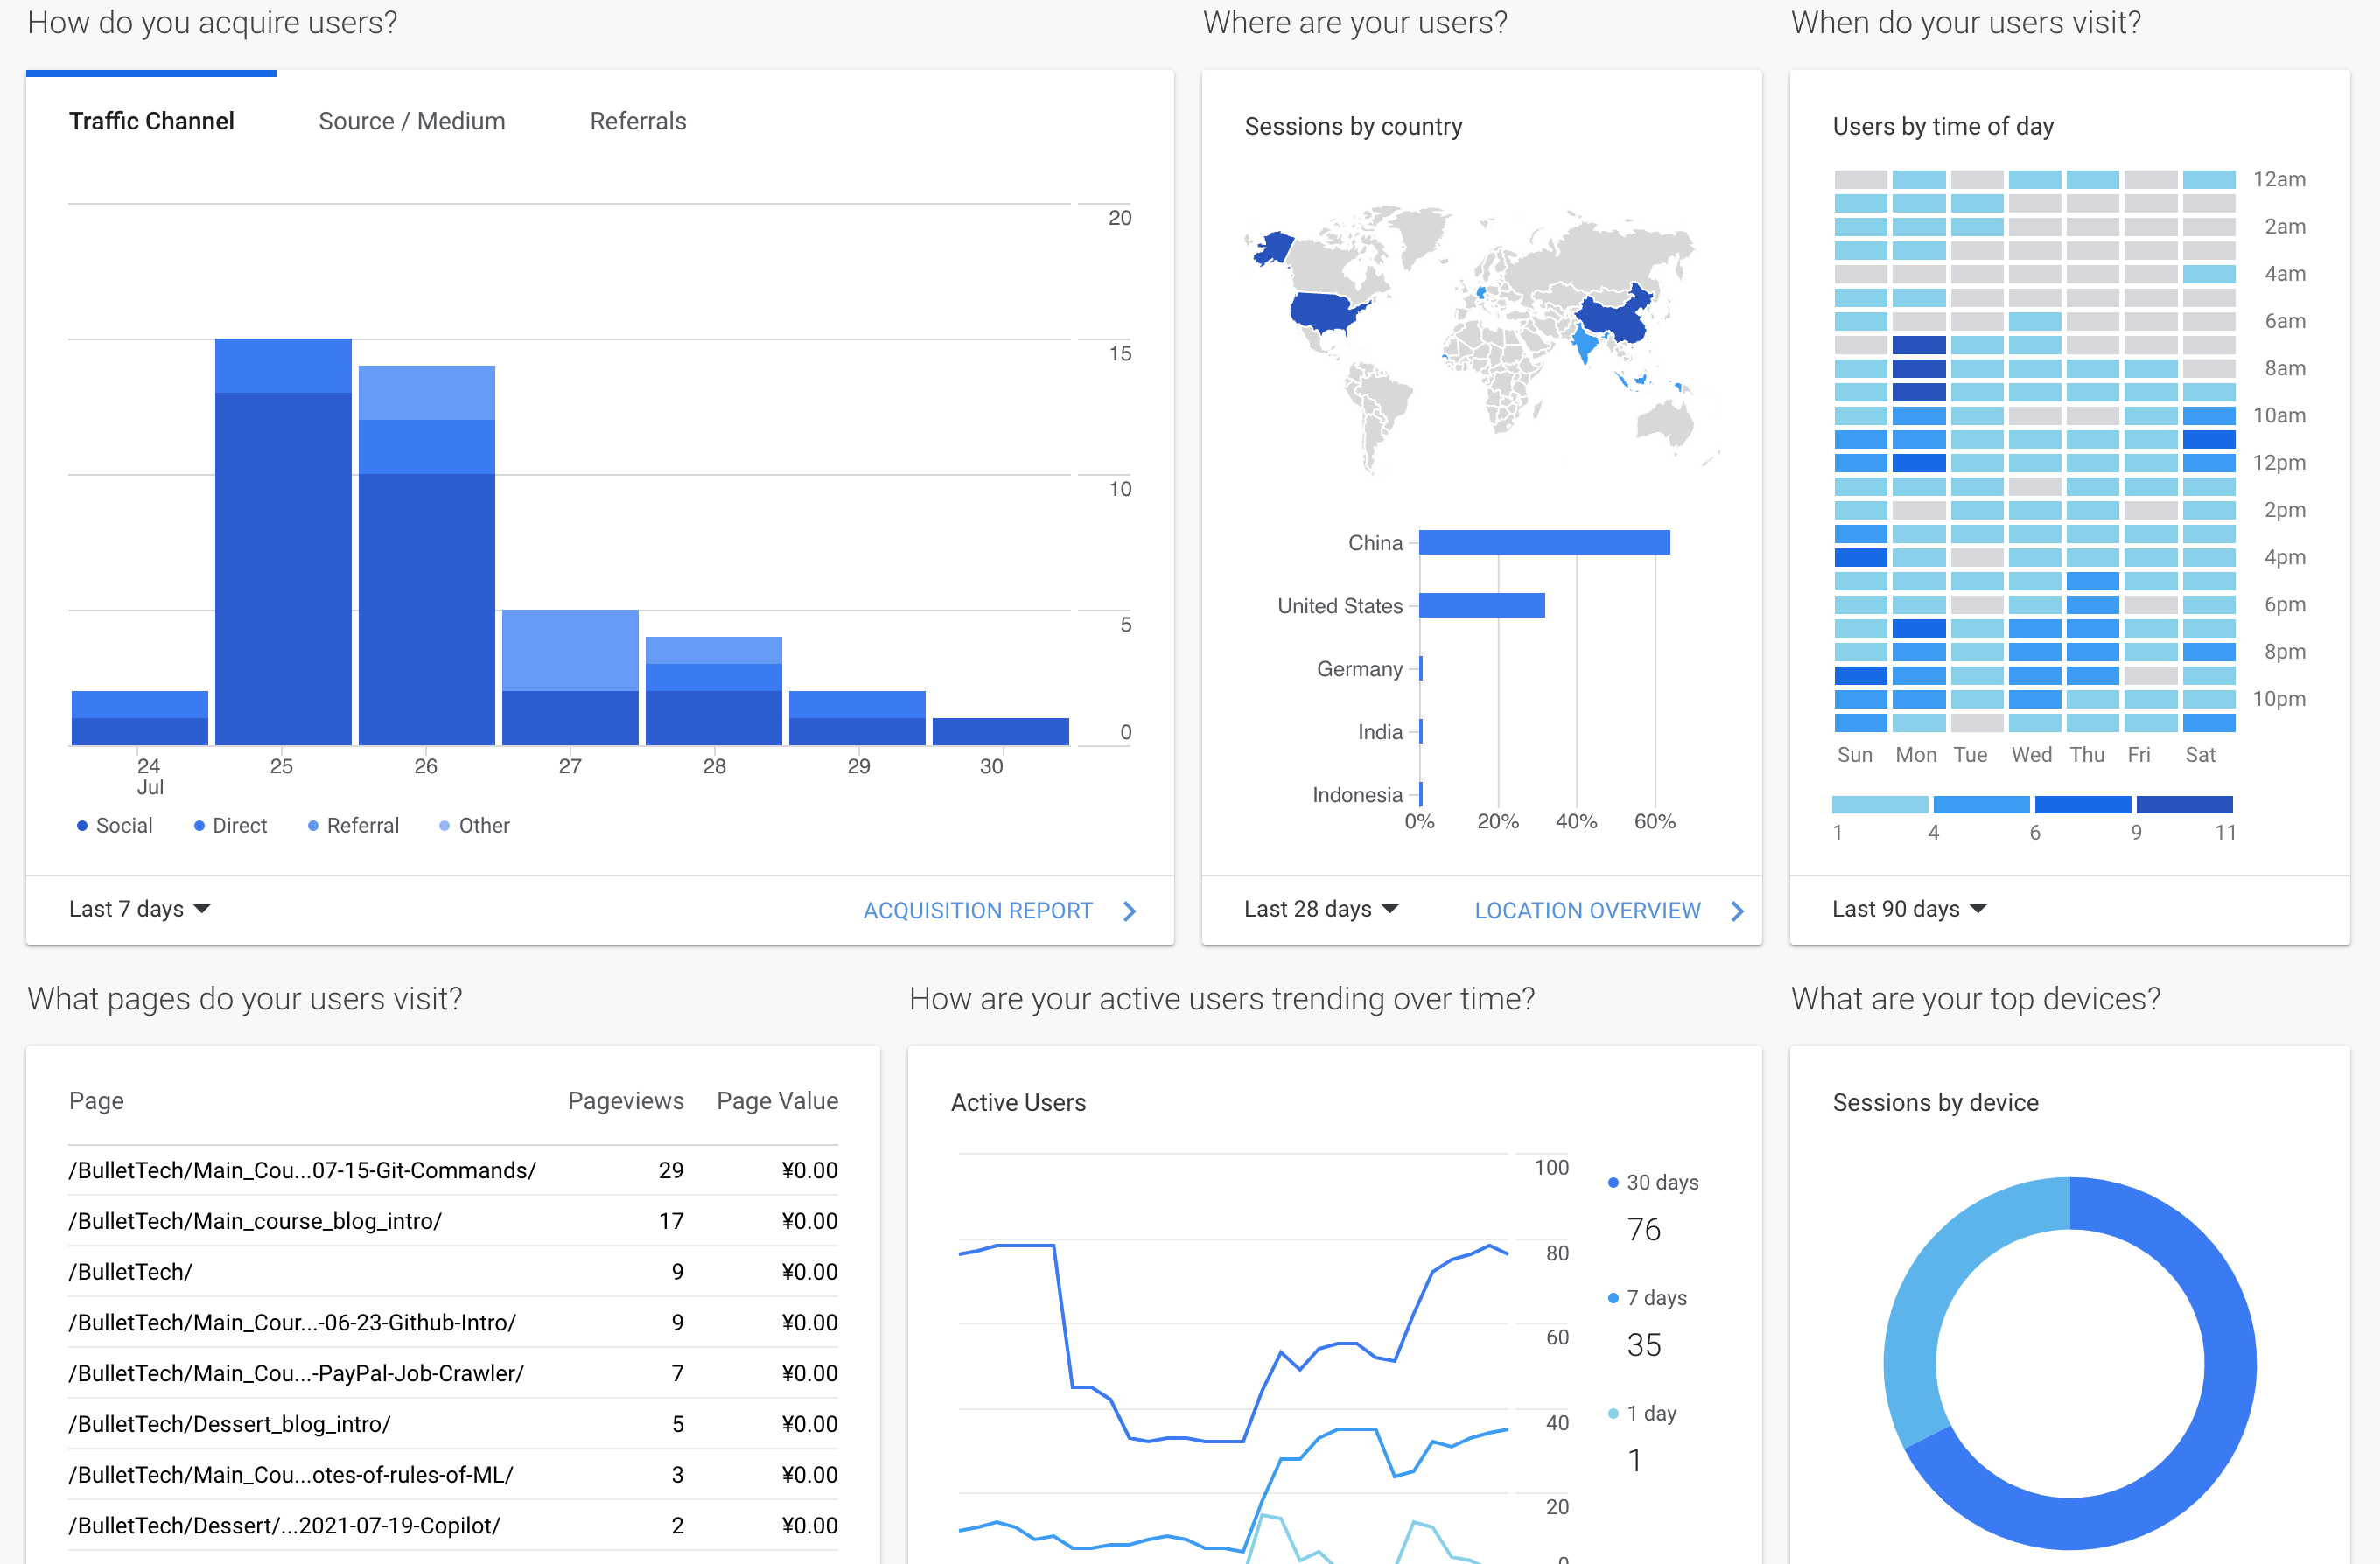
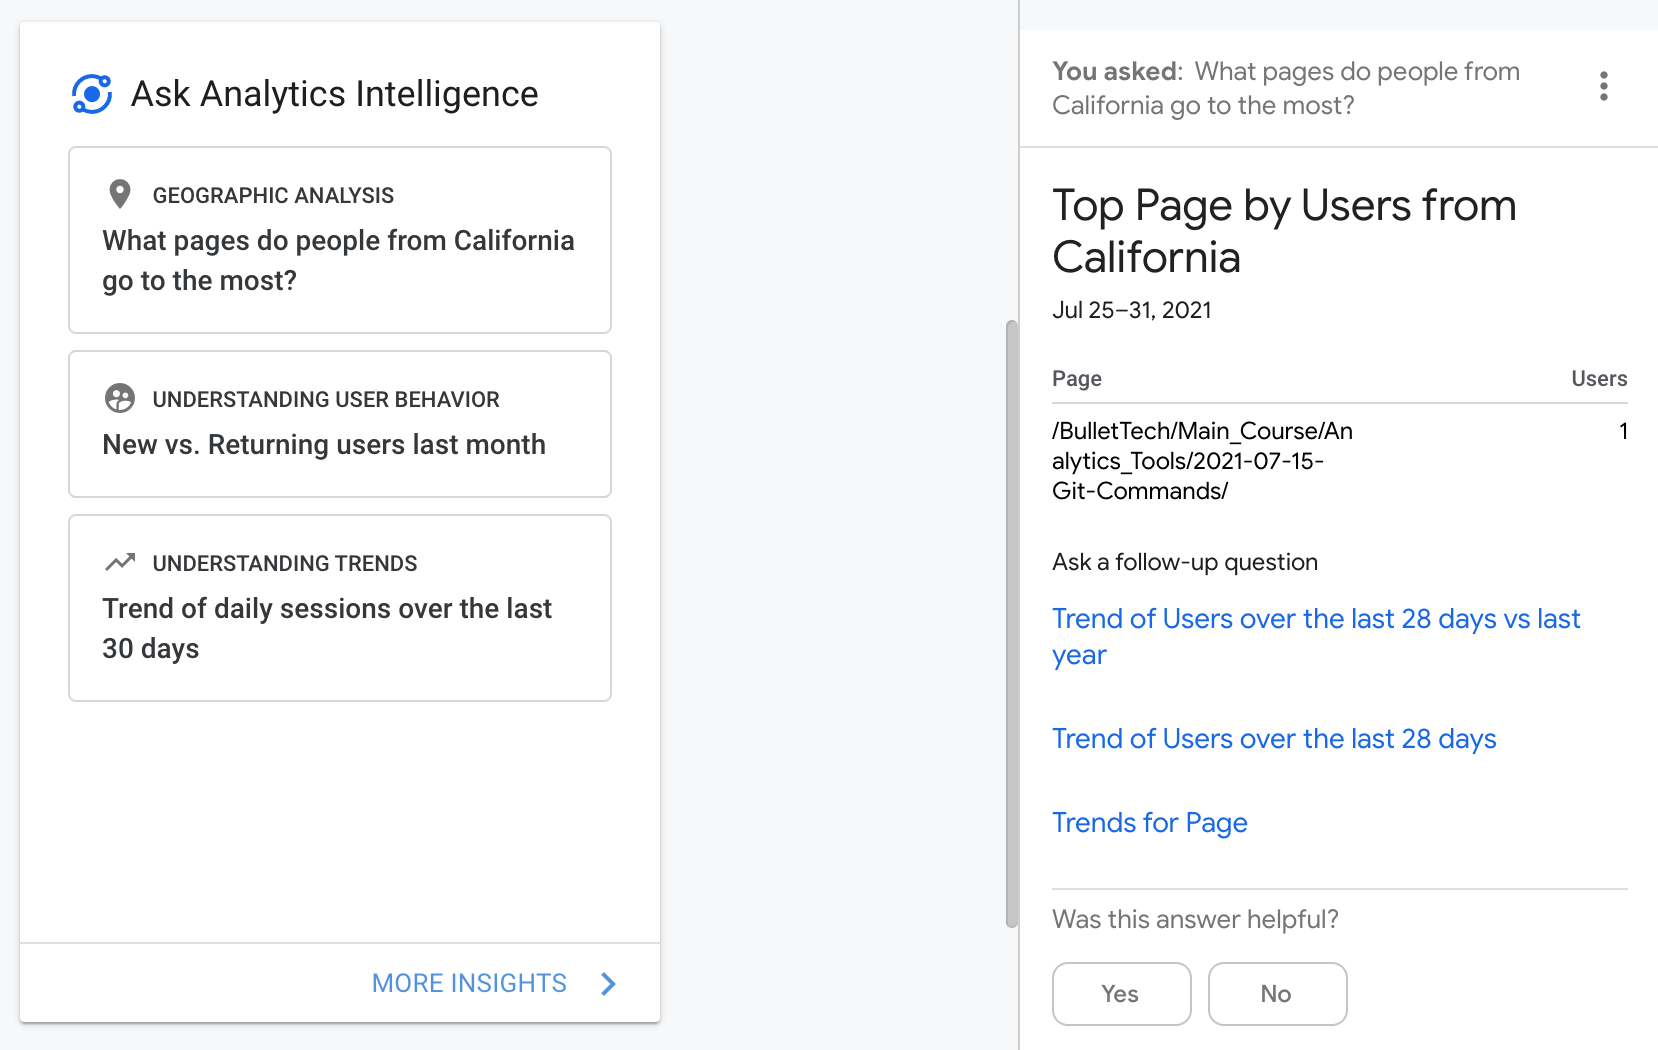
Home contains important indicators preset by Google for a quick overview of the site's overall performance, such as user volume, performance of various traffic sources, user geographic distribution, browsing time, most clicked pages, device type, etc. Google also provides an analysis intelligent module that can adaptively summarize insights.
3.2 Audience
This module is mainly used to describe user profiles, such as new and old users, geographic distribution, session performance, device type, operating system type, etc. This information helps you understand the overall situation of site users. There is even finer-grained information for viewing and analysis in the side tags.

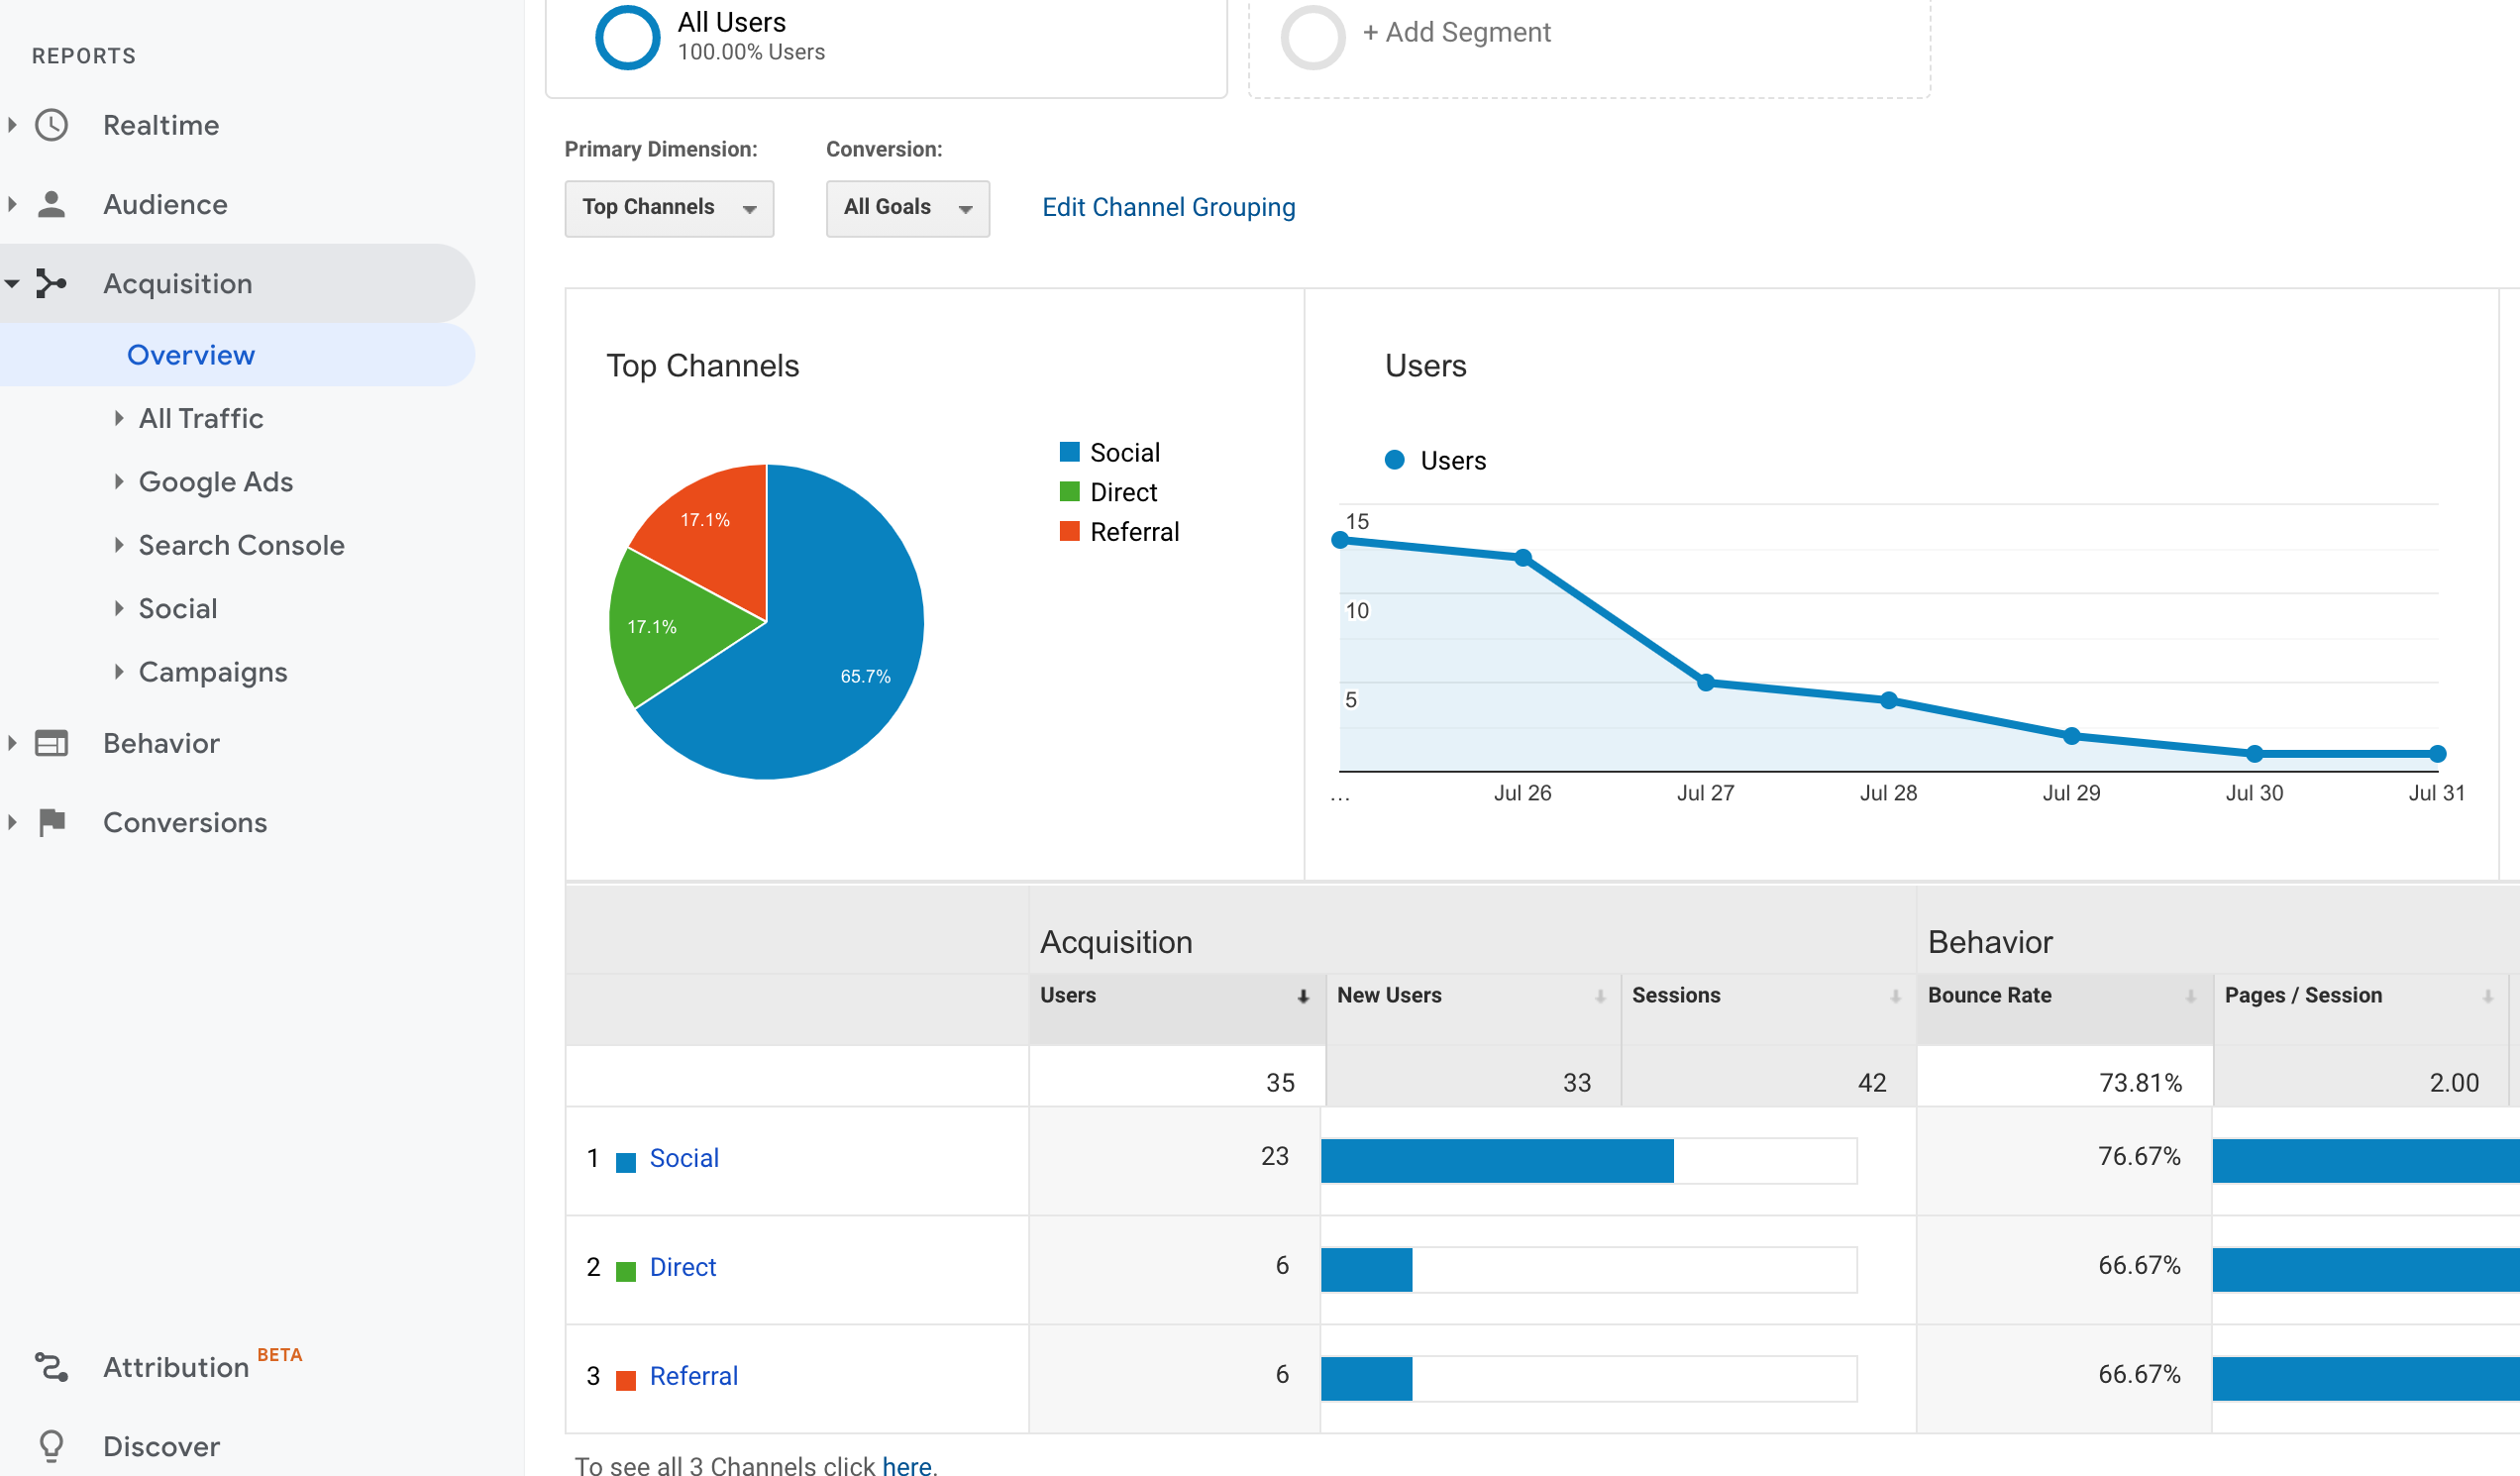
3.3 Acquisition
This section mainly introduces traffic sources such as orGoogle Analyticsnic traffic, social media drainage, direct clicks to enter, and referral traffic. It also includes traffic performance for each channel. This information helps to measure the traffic conversion effect of each channel and formulate promotion and traffic acquisition strategies. For example, BulletTech's blog is deployed on GitHub, and the search engine optimization of GitHub Pages is not favorable, so it does not have an advantage in natural traffic acquisition. The main source of traffic is clicking the original article link on various social media platforms to jump to the webpage.
3.4 User Behavior
The click-through rate of users on each page, the time they spend on each page, the page's incoming and outgoing links, bounce rate, and other information can be viewed in this module. These pieces of information can help you analyze user preferences for content, allowing for content to be more targeted.

3.5 Custom Reports
The above reports provide insight into different dimensions, and Google Analytics also provides options to build your own data indicator system more flexibly. By customizing reports, you can select various basic data and put them together into a special report suitable for your project. Google Analytics also offers a community to share data dashboards created by others, making it easier to refer to excellent report templates shared by others.
Conclusion
Google Analytics is like a beacon of light in the dark of the website, helping site builders better understand users and support decision-making. Google also provides a series of courses and analytics qualifications certification to help you learn Google Analytics more systematically. Google Analytics also supports analyzing mobile applications, making it a powerful multi-faceted tool!
I hope this share is helpful to you! Welcome to discuss in the comments!