Named Entity Recognition and Knowledge Graph for Natural Language Understanding

When handling textual descriptions in data science tasks, numerous approaches exist to comprehend them, including topic modeling, text classification, and sentiment analysis etc. However, these methods often necessitate additional explanation for audiences to grasp the results fully, particularly for individuals lacking technical expertise.
In this post, a novel method will be introduced, aiming to interpret relationships between elements in an easily understandable manner. This approach utilizes named entity recognition and knowledge graphs, offering a more accessible way to comprehend connections within the data.
1 Named Entity Recognition
Named Entity Recognition (NER) is a subfield of natural language processing (NLP) that deals with the identification and classification of named entities in text. Named entities are real-world objects or concepts that are mentioned in text, such as people, places, organizations, and products.
Here are a few well-known NER solution built with Python:
- spaCy: spaCy is a widely used and efficient library for natural language processing in Python. It provides a pre-trained statistical model for named entity recognition and allows customization of NER pipelines.
- NLTK (Natural Language Toolkit): NLTK is a comprehensive library for working with human language data. It includes various tools and modules for NER, albeit it might require more manual configuration compared to spaCy.
- Hugging Face Transformers: Hugging Face Transformers is a popular library providing various pre-trained language models for NER and other NLP tasks. It's known for its extensive collection of state-of-the-art models and easy-to-use pipelines.
- AllenNLP: AllenNLP is a powerful NLP library built on PyTorch, offering pre-built models and tools for various NLP tasks, including NER.
- Flair: Flair is an NLP library that allows for easy use of pre-trained word embeddings and state-of-the-art NLP models. It provides functionality for NER among other tasks.
- Stanford NER: Stanford NER is a widely-used Java-based tool that also offers Python bindings. It uses a statistical model to recognize named entities in text.
Here the spaCy is used to perform the NER task of below text:
texts = [
"Apple is planning to release a new iPhone model next month.",
"Samsung unveiled its latest flagship smartphone at the tech conference.",
"Google is investing heavily in artificial intelligence research.",
"Microsoft announced a major update for its Windows operating system.",
"Amazon launched a new line of smart home devices.",
"Google faced criticism over its data privacy policies.",
"Tesla's CEO Elon Musk tweeted about the company's future plans.",
"Uber is expanding its services to additional cities worldwide.",
"Netflix released a teaser for its upcoming original series.",
"Apple introduced new features for its social media platform."
]
And the spaCy pipeline is applied and the results are converted into a Pandas DataFrame:
python -m spacy download en_core_web_md in the terminal if you have not downloaded en_core_web_md before.import pandas as pd
import spacy
# Load the English language model for spaCy
nlp = spacy.load("en_core_web_md")
# Initialize lists to store extracted data
data = {'text': [], 'entities': [], 'labels': []}
# Process each text using spaCy NER
for text in texts:
doc = nlp(text)
entities = [ent.text for ent in doc.ents]
labels = [ent.label_ for ent in doc.ents]
# Append data to respective lists
data['text'].append(text)
data['entities'].append(entities)
data['labels'].append(labels)
# Create a pandas DataFrame
sp_df = pd.DataFrame(data)
sp_df.reset_index(inplace=True)
sp_dfThis is the output:
| index | text | entities | labels | |
|---|---|---|---|---|
| 0 | 0 | Apple is planning to release a new iPhone mode... | [Apple, iPhone, next month] | [ORG, PRODUCT, DATE] |
| 1 | 1 | Samsung unveiled its latest flagship smartphon... | [Samsung] | [ORG] |
| 2 | 2 | Google is investing heavily in artificial inte... | [Google] | [ORG] |
| 3 | 3 | Microsoft announced a major update for its Win... | [Microsoft, Windows] | [ORG, PRODUCT] |
| 4 | 4 | Amazon launched a new line of smart home devices. | [Amazon] | [ORG] |
| 5 | 5 | Google faced criticism over its data privacy p... | [Google] | [ORG] |
| 6 | 6 | Tesla's CEO Elon Musk tweeted about the compan... | [Tesla, Elon Musk] | [ORG, PERSON] |
| 7 | 7 | Uber is expanding its services to additional c... | [Uber] | [ORG] |
| 8 | 8 | Netflix released a teaser for its upcoming ori... | [Netflix] | [ORG] |
| 9 | 9 | Apple introduced new features for its social m... | [Apple] | [ORG] |
2 Graphs Analytics
2.1 Create the Relationship DataFrame
This step is to create a DataFrame that has the source and target:
# Empty lists to store relationship data
indexes = []
text_entities = []
entity_types = []
relationships = []

# Iterate through each row in the DataFrame
for idx, row in sp_df.iterrows():
    index = row['index']
    text = row['text']
    entities = row['entities']
    labels = row['labels']

    # Extract relationships between text and entities based on labels
    for i in range(len(entities)):
        indexes.append(index)
        text_entities.append(text)
        entity_types.append(entities[i])
        relationships.append(labels[i])

# Create a new DataFrame for relationships
relationship_df = pd.DataFrame({
    'Index':indexes,
    'Text': text_entities,
    'Entities': entity_types,
    'Relationship': relationships
})The relationship_df is like below, the Index works as source and Entities is the target.
| Index | Text | Entities | Relationship | |
|---|---|---|---|---|
| 0 | 0 | Apple is planning to release a new iPhone mode... | Apple | ORG |
| 1 | 0 | Apple is planning to release a new iPhone mode... | iPhone | PRODUCT |
| 2 | 0 | Apple is planning to release a new iPhone mode... | next month | DATE |
| 3 | 1 | Samsung unveiled its latest flagship smartphon... | Samsung | ORG |
| 4 | 2 | Google is investing heavily in artificial inte... | ORG | |
| 5 | 3 | Microsoft announced a major update for its Win... | Microsoft | ORG |
| 6 | 3 | Microsoft announced a major update for its Win... | Windows | PRODUCT |
| 7 | 4 | Amazon launched a new line of smart home devices. | Amazon | ORG |
| 8 | 5 | Google faced criticism over its data privacy p... | ORG | |
| 9 | 6 | Tesla's CEO Elon Musk tweeted about the compan... | Tesla | ORG |
| 10 | 6 | Tesla's CEO Elon Musk tweeted about the compan... | Elon Musk | PERSON |
| 11 | 7 | Uber is expanding its services to additional c... | Uber | ORG |
| 12 | 8 | Netflix released a teaser for its upcoming ori... | Netflix | ORG |
| 13 | 9 | Apple introduced new features for its social m... | Apple | ORG |
2.2 Create Graphs
Given above relationships, graphs can be created like below:
import networkx as nx

# Assuming relationship_df is the DataFrame from the previous step
# This DataFrame has columns 'Text', 'Entities', 'Relationship'

# Create an empty directed graph
graph = nx.DiGraph()

# Add edges and relationships to the graph
for _, row in relationship_df.iterrows():
    index = row['Index']
    text = row['Text']
    entity = row['Entities']
    relationship = row['Relationship']
    graph.add_edge(index, entity, relationship=relationship, desc=text)

# Display nodes, edges, and their attributes
print("Nodes:", graph.nodes())
print("Edges:")
for edge in graph.edges(data=True):
    print(edge)
The output is:
Nodes: [0, 'Apple', 'iPhone', 'next month', 1, 'Samsung', 2, 'Google', 3, 'Microsoft', 'Windows', 4, 'Amazon', 5, 6, 'Tesla', 'Elon Musk', 7, 'Uber', 8, 'Netflix', 9]
Edges:
(0, 'Apple', {'relationship': 'ORG', 'desc': 'Apple is planning to release a new iPhone model next month.'})
(0, 'iPhone', {'relationship': 'PRODUCT', 'desc': 'Apple is planning to release a new iPhone model next month.'})
(0, 'next month', {'relationship': 'DATE', 'desc': 'Apple is planning to release a new iPhone model next month.'})
(1, 'Samsung', {'relationship': 'ORG', 'desc': 'Samsung unveiled its latest flagship smartphone at the tech conference.'})
(2, 'Google', {'relationship': 'ORG', 'desc': 'Google is investing heavily in artificial intelligence research.'})
(3, 'Microsoft', {'relationship': 'ORG', 'desc': 'Microsoft announced a major update for its Windows operating system.'})
(3, 'Windows', {'relationship': 'PRODUCT', 'desc': 'Microsoft announced a major update for its Windows operating system.'})
(4, 'Amazon', {'relationship': 'ORG', 'desc': 'Amazon launched a new line of smart home devices.'})
(5, 'Google', {'relationship': 'ORG', 'desc': 'Google faced criticism over its data privacy policies.'})
(6, 'Tesla', {'relationship': 'ORG', 'desc': "Tesla's CEO Elon Musk tweeted about the company's future plans."})
(6, 'Elon Musk', {'relationship': 'PERSON', 'desc': "Tesla's CEO Elon Musk tweeted about the company's future plans."})
(7, 'Uber', {'relationship': 'ORG', 'desc': 'Uber is expanding its services to additional cities worldwide.'})
(8, 'Netflix', {'relationship': 'ORG', 'desc': 'Netflix released a teaser for its upcoming original series.'})
(9, 'Apple', {'relationship': 'ORG', 'desc': 'Apple introduced new features for its social media platform.'})
2.3 Visualization
The linkage can be visualized as below:
import matplotlib.pyplot as plt

# Perform connected component analysis
connected_components = list(nx.connected_components(graph.to_undirected()))

# Find the connected components with more than one node
connected_components = [component for component in connected_components if len(component) > 1]

# Display the connected components
print("Connected components:")
for idx, component in enumerate(connected_components, start=1):
    print(f"Component {idx}: {component}")

# Visualize the graph (optional)
pos = nx.spring_layout(graph)
nx.draw(graph, pos, with_labels=True, node_size=500, font_size=8)
plt.show()The output is:
Connected components:
Component 1: {0, 9, 'next month', 'Apple', 'iPhone'}
Component 2: {1, 'Samsung'}
Component 3: {2, 5, 'Google'}
Component 4: {'Microsoft', 3, 'Windows'}
Component 5: {4, 'Amazon'}
Component 6: {'Elon Musk', 'Tesla', 6}
Component 7: {'Uber', 7}
Component 8: {8, 'Netflix'}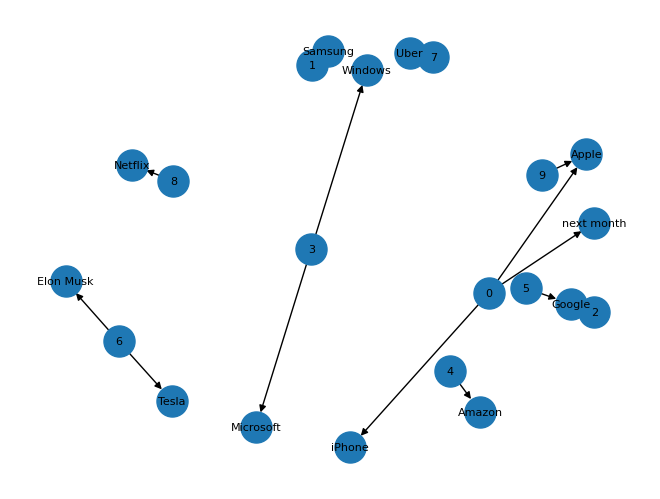
3 Conclusion
Unlike other NLP tasks highlighted earlier, this NER+Graph approach unveils crucial information within the text, leveraging graph structures to interconnect shared information. This method tends to be more deterministic, sidestepping lengthy learning curves and potential controversies when conveying insights to an audience.
Moreover, numerous graph algorithms can be employed to delve deeper into the connections among these elements. These explorations will be detailed in subsequent posts.